Introduction
Crypto looks exciting when prices rise quickly, but the same market can become confusing when candles change direction, trading volume jumps, or social media starts predicting sudden gains and crashes. Many beginners open a chart and see only coloured bars, unfamiliar indicators, and rapidly changing numbers. Without understanding what the chart actually represents, they may buy after a sharp rally, sell during normal volatility, or risk money based on one pattern. Learning how to read crypto market charts helps beginners examine price behaviour, market direction, momentum, and risk more logically. It does not guarantee correct predictions, but it can replace emotional reactions with a structured process. This guide explains chart reading in simple language so investors, traders, students, salaried professionals, and crypto learners can build practical awareness before making decisions.
What is Crypto Market Charts ?
A crypto market chart is a visual record of how the price of a cryptocurrency has changed over a selected period. Instead of reading hundreds of individual transactions, a chart turns market activity into lines, bars, candles, volume columns, and indicators.
Most cryptocurrency charts show a trading pair. A pair compares one asset with another. For example, BTC/USDT shows the price of Bitcoin measured in USDT. ETH/BTC shows the price of Ether measured in Bitcoin.
A chart normally contains four basic elements:
- The selected cryptocurrency pair
- The price scale
- The time scale
- Price candles or another chart type
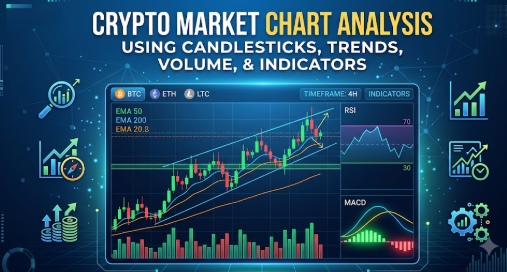
Candlestick charts are widely used because each candle can display the opening, highest, lowest, and closing prices for a selected interval. These values are commonly described as OHLC, while charts that also include volume may be described as OHLCV.
For example, on a one-hour chart, each candle represents one hour of price activity. On a daily chart, each candle represents one full day. The same market can look bullish on a 15-minute chart but bearish on a weekly chart because the charts measure different periods.
A common misunderstanding is that a chart tells traders exactly what will happen next. It does not. A chart shows what buyers and sellers have already done and helps people evaluate possible future scenarios.
The practical takeaway is simple: read the chart as evidence, not as a promise.
Why Reading Crypto Market Charts Is Important
Learning how to read crypto market charts can improve several areas of financial decision-making.
It creates awareness of price direction
A chart helps readers see whether the market is generally rising, falling, or moving sideways. This makes it easier to avoid buying only because a coin is attracting online attention.
It helps identify risk
Rapid price movement, weak liquidity, large candles, and sudden volume spikes may indicate higher risk. Recognising these conditions can encourage smaller positions or no trade at all.
It improves entry planning
Instead of buying at a random price, a person can identify important price zones and wait for clearer confirmation.
It supports exit planning
Charts help traders define where an idea becomes invalid. This can be more disciplined than holding indefinitely and hoping the market recovers.
It reduces emotional decisions
Fear and greed often become stronger when prices move quickly. A written chart-analysis process can prevent impulsive reactions.
It strengthens long-term investing discipline
Long-term investors can use higher-timeframe charts to understand whether they are buying during extreme excitement, prolonged weakness, or a stable accumulation period.
It improves financial planning
Crypto should be viewed as a high-risk part of a wider financial plan, not as guaranteed income. Understanding chart volatility can help readers decide how much exposure is appropriate.
Consider a salaried employee who sees a coin rise sharply in one day. Without chart knowledge, the employee may invest emergency savings because the move appears certain to continue. After checking the daily trend, volume, resistance area, and recent volatility, the employee may recognise that the price is already extended and decide to wait or avoid the trade.
The Real Problems Readers Face with Crypto Market Charts
The difficulty is not simply that charts contain many lines. The deeper problem is that beginners often do not have a repeatable method.
Too much conflicting advice
One person may say a chart is bullish while another calls it bearish. Both may be looking at different timeframes, indicators, or price levels.
Depending on social media
Screenshots shared online often omit the wider trend, trading pair, timeframe, or invalidation point. A prediction may look convincing without showing the full risk.
Treating indicators as automatic signals
An indicator can support an analysis, but it should not replace price structure, volume, context, and risk management.
Unrealistic expectations
Beginners may believe professional traders accurately predict every candle. In reality, chart analysis works with probability, uncertainty, and loss control.
Ignoring the trading pair
A cryptocurrency may rise against one currency while weakening against another. Readers must confirm what asset is being used as the quote currency.
Using the wrong timeframe
A person planning to hold for several months may panic over a five-minute candle. Another person making a short-term trade may rely only on a monthly chart.
Weak risk planning
Many beginners decide where to buy but not where to exit if the analysis fails.
Emotional interpretation
People often search for signals that support what they already want to believe. A holder may ignore bearish evidence, while a fearful trader may ignore improving conditions.
Not knowing the next step
After drawing support, resistance, and indicators, beginners may still not know whether to enter, wait, reduce risk, or reject the setup.
The better approach is to follow the same checklist every time: confirm the pair, select the timeframe, identify the trend, mark important zones, examine volume, use limited indicators, create scenarios, and define risk before taking action.
How to Read Crypto Market Charts Step by Step
Step 1: Confirm the Cryptocurrency Pair
Start by reading the pair shown at the top of the chart. BTC/USDT means Bitcoin is the base asset and USDT is the quote asset. The displayed price tells you how much USDT is needed to buy one Bitcoin.
This matters because the same cryptocurrency can behave differently across different pairs. ETH/USDT and ETH/BTC are not measuring the same relationship.
To apply this step, write down the pair before analysing anything else. Check whether the chart represents a spot market, perpetual contract, futures product, or another instrument.
For example, if ETH/USDT is rising but ETH/BTC is falling, Ether may be gaining against USDT while still underperforming Bitcoin.
A common mistake is analysing a screenshot without checking the pair. The better approach is to confirm the market, exchange, and instrument before interpreting the price.
Step 2: Choose a Suitable Timeframe
The timeframe determines how much market activity each candle represents. A five-minute candle summarises five minutes, while a daily candle summarises one day.
This matters because timeframe selection should match the decision. Investors may focus on weekly and daily charts, while short-term traders may use four-hour, one-hour, or lower timeframes.
To apply this step, start with a higher timeframe to understand the broader market structure. Then move to a lower timeframe only when more precise detail is needed.
For example, a trader may identify an upward trend on the daily chart and use the four-hour chart to examine a pullback.
A common mistake is switching between timeframes until one supports a desired opinion. The better approach is to decide the analysis timeframe before studying the chart.
Step 3: Understand Each Candlestick
Every candlestick shows four prices: open, high, low, and close. The body represents the distance between the opening and closing prices. The upper and lower wicks show how far the price moved beyond the body.
A bullish candle usually closes above its opening price. A bearish candle usually closes below it. Chart colours may vary by platform, so readers should confirm the settings rather than assume green always means bullish.
This step matters because candle structure reveals how buyers and sellers behaved during the selected period.
For example, a candle with a long lower wick may show that sellers pushed the price downward before buyers moved it back up. However, this does not automatically guarantee a reversal.
A common mistake is trading based on one candle. The better approach is to evaluate the candle’s location, trend, support or resistance zone, volume, and following confirmation.
Step 4: Identify the Market Trend
A trend describes the general direction of price movement.
An uptrend often forms higher highs and higher lows. A downtrend often forms lower highs and lower lows. A sideways market moves within a broad range without a clear directional structure.
Trend identification matters because a setup that works in an uptrend may fail in a downtrend.
To apply this step, reduce unnecessary indicators and examine the sequence of visible highs and lows. Draw simple trend lines only where they connect meaningful price points.
For example, if each major pullback remains above the previous low and the price continues making higher highs, the market may be in an uptrend.
A common mistake is calling every short rally an uptrend. The better approach is to evaluate a series of price swings rather than one candle.
Step 5: Mark Support and Resistance Zones
Support is an area where buying interest has previously become stronger. Resistance is an area where selling pressure has previously increased. These should normally be treated as zones, not perfect single-price lines.
This matters because prices often react near areas where market participants previously made important decisions.
To apply this step, mark zones around repeated swing highs, swing lows, consolidation areas, and former breakout levels. Give more importance to levels that produced strong reactions or were tested multiple times.
For example, if a cryptocurrency repeatedly stops falling near the same price area, that region may act as support.
A common mistake is drawing too many lines until every price movement appears meaningful. The better approach is to keep only the clearest and most relevant zones.
Step 6: Examine Trading Volume
Volume shows how much market activity occurred during a selected period. It helps readers judge whether a price move has meaningful participation.
Volume matters because a breakout with increasing activity may deserve more attention than a breakout occurring on weak volume. However, volume should still be interpreted with the wider market context.
To apply this step, compare current volume with recent average activity. Look for changes rather than focusing only on one volume bar.
For example, if the price moves above resistance while volume expands significantly, the move may have stronger participation. If the price crosses resistance on unusually weak volume, the breakout may require more confirmation.
A common mistake is assuming high volume is always bullish. High volume can appear during aggressive buying, panic selling, liquidation, or distribution. The better approach is to examine volume together with candle direction and price location.
Step 7: Add One or Two Supporting Indicators
Indicators convert price or volume data into additional visual information. Common examples include moving averages, the Relative Strength Index, and the Moving Average Convergence Divergence indicator.
Indicators matter because they can help measure trend, momentum, or changing market conditions. However, several indicators may use similar price data and provide repetitive signals.
To apply this step, select indicators that answer different questions. A moving average may help with trend, while RSI may help evaluate momentum.
For example, a trader may observe an upward price structure, a rising moving average, and improving momentum. Together, these may support the same scenario.
A common mistake is adding many indicators until the chart becomes unreadable. The better approach is to use a small number of tools and understand their limitations.
Step 8: Build a Scenario and Risk Plan
The final step is not to predict one guaranteed outcome. It is to create possible scenarios.
Write down what would support a bullish view, what would support a bearish view, and what would invalidate the analysis.
This matters because every chart setup can fail. Investment risk involves uncertainty and the possibility of financial loss.
For example, a trader may consider an entry only if the price closes above resistance with supportive volume. The idea may be considered invalid if the price returns below the breakout zone.
A common mistake is entering first and planning later. The better approach is to define the entry condition, invalidation point, maximum acceptable loss, and exit strategy before committing money.
Key Factors That Influence Crypto Market Charts
Market volatility
Crypto prices can move rapidly in both directions. Higher volatility creates opportunities but also increases the possibility of slippage, emotional decisions, and significant losses.
The common mistake is increasing position size because the market appears active. The better approach is often to reduce size when volatility expands.
Liquidity
Liquidity describes how easily an asset can be bought or sold without causing a major price change.
Highly liquid markets generally have tighter spreads and deeper order books. Thinly traded tokens may experience sudden jumps, large spreads, and poor execution.
Beginners should compare activity across reputable markets and be cautious with assets that show irregular price candles or very low volume.
Trading volume
Volume helps measure participation. Rising price with rising volume may show stronger buyer involvement, while falling volume during a rally may suggest weakening participation.
Volume should not be used alone because exceptional activity can occur for many reasons.
Market sentiment
News, regulation, exchange events, token developments, broader economic conditions, and social media discussions can change market behaviour.
Charts may show the reaction, but they may not explain the cause. Readers should avoid assuming that every move is purely technical.
Timeframe
Different timeframes can produce different signals. A short-term bearish move may be only a small pullback within a long-term uptrend.
The better approach is to use a higher timeframe for context and a lower timeframe for detail.
Exchange reliability
Prices and volume may vary slightly across exchanges. Smaller or less reliable platforms may also show unusual candles caused by weak liquidity or poor data quality.
Use reputable data sources and confirm major price movements across more than one market when necessary.
Transaction and trading fees
Frequent trading can create costs through trading fees, spreads, network charges, funding payments, and slippage.
A chart setup may appear profitable before costs but become unattractive after all charges are included.
Leverage
Leverage allows a trader to control a larger position with less capital, but it can magnify losses and increase liquidation risk.
Beginners should not assume that better chart reading makes leverage safe. Leveraged crypto products can create losses faster than expected.
Scam and manipulation risk
Low-liquidity tokens may be vulnerable to misleading promotion, coordinated buying, fake volume, or pump-and-dump activity. Regulators regularly warn that virtual currency trading can involve volatility, fraud, cybersecurity, and platform-related risks.
Emotional control
A chart does not remove fear, greed, impatience, or overconfidence. A trader can understand every indicator and still make a poor decision under pressure.
Written rules, position limits, and regular review are essential parts of chart analysis.
Detailed Breakdown of Crypto Market Chart Analysis
Line charts
A line chart normally connects closing prices over time. It offers a clean view of the overall trend but removes information about opening prices, intraperiod highs, and lows.
Line charts can be useful when a beginner wants to understand the broader direction without becoming distracted by every candle.
The mistake is using a line chart for detailed entries. A candlestick chart usually provides more information for precise analysis.
Candlestick charts
Candlestick charts provide detailed information about each selected period. A candle with a large body shows a stronger difference between the open and close. A small body may show limited movement or uncertainty.
Long wicks can indicate rejection, volatility, or temporary movement beyond a level. However, candle meaning depends on its location.
A bullish-looking candle in the middle of a random range may provide little value. The same candle appearing after a long decline at a major support zone may deserve more attention.
Market structure
Market structure refers to the sequence of highs, lows, impulses, and pullbacks.
Important questions include:
- Is the price making higher or lower swing points?
- Has a previous important high or low been broken?
- Is the market trending or ranging?
- Is momentum strengthening or weakening?
- Has the market returned to a previously important zone?
Beginners often focus on candle names before learning structure. The better approach is to understand the broader sequence first.
Support and resistance
Support and resistance represent areas where demand and supply have previously influenced the price.
Support may become resistance after a breakdown. Resistance may become support after a confirmed breakout. This is sometimes called a role reversal.
A level becomes more useful when it is visible, relevant to the selected timeframe, and supported by previous reactions. It is not useful merely because a line can be drawn through one random point.
Breakouts
A breakout occurs when the price moves beyond an established level or range.
A valid-looking breakout may include:
- A close beyond the zone
- Expanding volume
- Strong candle structure
- Follow-through after the break
- A successful retest
- Alignment with the broader trend
A false breakout occurs when the price moves beyond a level but quickly returns inside the previous area.
The mistake is entering the moment a wick crosses resistance. The better approach may be to wait for a close, confirmation, or retest.
Pullbacks
A pullback is a temporary move against the broader trend.
In an uptrend, a pullback may move downward toward former resistance, a moving average, or another support zone. In a downtrend, a temporary rally may move toward resistance.
A pullback should not automatically be treated as a buying opportunity. Traders must check whether the main structure remains valid.
Ranges
A range develops when the price moves between an identifiable support zone and resistance zone.
Range conditions can create repeated reactions, but they can also produce false signals near both boundaries.
The middle of a range often offers weaker risk-to-reward conditions because the price is far from both the support and resistance zones.
Trading volume
Volume can provide context for breakouts, reversals, and trend continuation.
Some useful observations include:
- Rising price with increasing volume may show strong participation.
- Rising price with declining volume may indicate weaker participation.
- A large bearish candle with very high volume may reflect panic or liquidation.
- Repeated volume increases near support may show active buying interest.
- Sudden volume in an illiquid token may also indicate manipulation.
Volume must be interpreted as evidence, not as a direct trade command.
Moving averages
A moving average smooths price data over a selected number of periods.
A shorter moving average reacts faster but may generate more noise. A longer moving average reacts slowly and may help identify the broader trend.
Possible uses include:
- Identifying trend direction
- Observing dynamic support or resistance
- Comparing short-term and long-term momentum
- Filtering trades against the dominant trend
The mistake is assuming a moving-average crossover guarantees a profitable move. Crossovers can occur late and perform poorly in sideways markets.
Relative Strength Index
RSI is a momentum oscillator that measures the speed and magnitude of recent price changes on a scale from zero to 100. It is commonly used to study momentum, possible overbought or oversold conditions, and divergence.
A high RSI does not automatically mean the price must fall. Strong markets can remain at elevated RSI levels. A low RSI does not guarantee an immediate rebound.
A better approach is to combine RSI with trend, support, resistance, and price behaviour.
Moving Average Convergence Divergence
MACD uses moving-average relationships to help readers examine trend direction and momentum.
It can be useful for identifying momentum shifts, but signals may appear after much of the price move has already occurred.
Beginners should avoid using every crossover as an entry signal.
Chart patterns
Chart patterns are repeated price formations such as triangles, flags, ranges, double tops, and double bottoms.
These patterns may help identify possible continuation or reversal scenarios, but they do not guarantee an outcome. They are more useful when evaluated with volume, market structure, support, resistance, and risk management.
Order books
An order book displays current bids and asks for an asset. Bids represent active buy orders, while asks represent active sell orders.
Order books can help readers observe spreads and available liquidity. However, visible orders can be cancelled, moved, or placed to create a misleading impression.
The better approach is to treat order-book data as temporary information rather than a guarantee of support or resistance.
Crypto investing versus trading
Investing usually focuses on long-term ownership, project quality, adoption, valuation, portfolio allocation, and risk tolerance.
Trading focuses more heavily on shorter-term price movement, entries, exits, position sizing, and market structure.
A long-term investor may use charts to avoid emotionally chasing extreme price moves. A trader may use charts to define a specific setup and invalidation level.
Neither approach removes risk, and chart analysis should not replace research into the cryptocurrency itself.
Common Mistakes Beginners Make with Crypto Market Charts
Following random chart predictions
This happens because confident predictions appear easier than learning analysis.
It is risky because the person sharing the prediction may have a different entry, timeframe, risk tolerance, or financial interest.
Instead, verify the trading pair, timeframe, price structure, volume, and invalidation level independently.
Treating one candle as complete evidence
A dramatic candle can create fear or excitement. However, one candle may be part of a normal pullback, false breakout, or liquidity event.
Wait for context and confirmation before drawing a conclusion.
Ignoring the higher timeframe
A five-minute reversal may appear important while remaining almost invisible on a daily chart.
Check the broader trend before acting on a lower-timeframe setup.
Using too many indicators
Adding several indicators can create confusion and false confidence. Many indicators use similar underlying price information.
Use a limited set of tools that serve clearly different purposes.
Buying after an extended rally
Beginners often enter after seeing several large bullish candles because they fear missing the opportunity.
The risk is buying near resistance or during temporary excitement. The better action may be to wait for a pullback, consolidation, or clearer structure.
Selling in panic
A normal market pullback may trigger fear, especially when the position is too large.
Use a planned position size and determine the invalidation point before entering.
Ignoring volume
A breakout may look convincing based only on price. Weak participation can make the move less reliable.
Check whether volume supports the price action.
Drawing too many levels
An overcrowded chart allows almost any move to be explained afterward.
Mark only major zones that influenced meaningful price reactions.
Using emergency money
Chart knowledge cannot eliminate market loss. Money required for rent, medical costs, debt payments, education, or essential needs should not be exposed to high-risk speculation.
Keep emergency savings separate.
Assuming technical analysis guarantees returns
Technical analysis is a decision-support method, not a guaranteed profit system.
A strong setup can still fail because of news, liquidity changes, market sentiment, or normal uncertainty.
Ignoring fees and slippage
Frequent entries and exits can increase costs.
Calculate whether the expected opportunity remains reasonable after spreads, fees, funding costs, taxes, and slippage.
Sharing account or wallet information
Fake mentors and support accounts may ask for passwords, seed phrases, remote access, or wallet connection approvals.
Never share a seed phrase or private key. Verify platforms and protect personal information.
Don’t Do This Checklist
- Do not buy only because a candle is green.
- Do not sell only because a candle is red.
- Do not treat one indicator as confirmation.
- Do not copy an online entry without understanding its risk.
- Do not use emergency savings for speculative trades.
- Do not increase leverage to recover a loss.
- Do not move a risk limit simply because the trade is failing.
- Do not assume high volume is automatically bullish.
- Do not trust guaranteed-return claims.
- Do not share passwords, private keys, or seed phrases.
- Do not ignore trading costs or tax responsibilities.
- Do not trade while under emotional or financial pressure.
Practical Real-Life Examples of Crypto Chart Reading
Example 1: A Salaried Employee Avoids Chasing a Rally
A salaried employee sees a cryptocurrency rise sharply during the workday and considers buying immediately. The daily chart shows that the asset is approaching a previous resistance zone after several large candles. Instead of chasing the price, the employee waits for consolidation or a pullback. The learning is that missing one move is safer than entering without a risk plan.
Example 2: A Beginner Confirms a Breakout
A beginner notices that a coin has moved slightly above resistance. The first instinct is to buy, but volume is weak and the candle has not closed. The price later returns inside the range. The learning is that a temporary move beyond a level is not always a confirmed breakout.
Example 3: An Investor Uses the Weekly Chart
A long-term investor becomes worried after a cryptocurrency falls on the 15-minute chart. The weekly chart shows that the movement is small compared with the broader trend. The investor reviews the original allocation and research rather than reacting to short-term noise. The learning is to match the timeframe with the holding period.
Example 4: A Trader Reduces Position Size
A trader identifies a promising setup, but the candles are unusually large and price movement is unstable. Instead of using the normal position size, the trader reduces exposure and places the invalidation point logically. The learning is that position size should respond to volatility.
Example 5: A Crypto Learner Rejects a Social Media Tip
A social media post claims that a low-volume token is about to rise significantly. The learner checks the chart and finds weak liquidity, irregular candles, and a sudden unexplained volume spike. The learner avoids the trade and protects personal capital. The learning is that chart review can help identify situations requiring extra caution.
Two Useful Tables for Better Understanding
Table 1: Candlestick Information and Practical Meaning
| Chart Element | What It Shows | Practical Use | Common Mistake |
|---|---|---|---|
| Open | Price at the beginning of the period | Compares starting and closing sentiment | Ignoring the selected timeframe |
| High | Highest traded price during the period | Shows the upper limit reached | Treating every high as resistance |
| Low | Lowest traded price during the period | Shows the lower limit reached | Treating every low as support |
| Close | Price at the end of the period | Helps evaluate candle direction and strength | Acting before the candle closes |
| Body | Distance between open and close | Shows the strength of the price move | Assuming a large body guarantees continuation |
| Wick | Movement beyond the candle body | May reveal rejection or volatility | Trading from a wick without confirmation |
| Volume | Trading activity during the period | Helps evaluate market participation | Assuming high volume is always positive |
Table 2: Timeframe Selection Based on Purpose
| Purpose | Useful Starting Timeframes | Main Focus | Risk to Avoid |
|---|---|---|---|
| Long-term investing | Weekly and daily | Broad trend and major price zones | Reacting to minute-by-minute volatility |
| Swing trading | Daily and four-hour | Trend, pullbacks, breakouts, and structure | Entering without checking the wider trend |
| Short-term trading | Four-hour, one-hour, and lower | Entry detail, momentum, and short-term levels | Overtrading and excessive fees |
| Range analysis | Timeframe where boundaries are clearest | Support, resistance, and failed breakouts | Trading in the middle of the range |
| Breakout analysis | Higher timeframe plus entry timeframe | Candle close, volume, follow-through, and retest | Buying the first wick above resistance |
| Risk review | Daily and weekly | Volatility and invalidation zones | Using a risk limit that is too close or too large |
Tools, Methods, and Frameworks Readers Can Use
Clean-chart method
Remove most indicators and begin with price candles, volume, and major levels.
This helps beginners see the real market structure without visual overload. It prevents the mistake of allowing several indicators to replace basic price analysis.
Top-down analysis
Start with the weekly or daily chart and then move to a lower timeframe.
The higher timeframe provides context, while the lower timeframe provides detail. This method helps prevent a small short-term move from being mistaken for a major trend change.
Support and resistance worksheet
Record each major zone, the number of visible reactions, the timeframe, and whether the zone acted as support or resistance.
This creates consistency and reduces random line drawing.
Trade scenario template
Write down:
- Market and pair
- Main timeframe
- Current trend
- Important support
- Important resistance
- Entry condition
- Invalidation condition
- Maximum acceptable loss
- Exit plan
- Reason for avoiding the setup
This framework forces the reader to consider risk before taking action.
Crypto analysis journal
Keep a record of chart screenshots, reasoning, actions, emotions, and outcomes.
The journal helps identify repeated mistakes such as chasing price, entering without confirmation, increasing size after losses, or exiting too early.
Position-sizing method
Position sizing determines how much capital is placed at risk based on the distance between the entry and invalidation point.
Beginners should decide the maximum acceptable loss first and calculate the position afterward. They should not choose a large position and then force the risk level to fit it.
Indicator limit
Use no more than one trend indicator and one momentum or volume-based tool while learning.
This creates a cleaner decision process and avoids repetitive signals.
Breakout confirmation checklist
Before treating a move as a breakout, check:
- Did the candle close outside the zone?
- Did volume expand?
- Is the wider trend supportive?
- Was there follow-through?
- Did the price retest the level?
- Is the entry too far from the invalidation point?
This method helps reduce emotional entries.
Risk-first review
Before analysing the expected return, ask what could go wrong.
Check liquidity, volatility, exchange reliability, cybersecurity, fees, leverage, and the amount of capital at risk.
Monthly learning review
At the end of each month, review decisions instead of focusing only on profit or loss.
A profitable trade may still have been poorly planned, while a losing trade may have followed a disciplined process. The goal is to improve decision quality.
Expert Tips to Make Better Chart Decisions
1. Begin with the higher timeframe
The higher timeframe helps reveal the dominant market structure. Check it before reacting to lower-timeframe volatility.
2. Read price before indicators
Indicators are calculated from market data and usually react after price has moved. Understand the candles and structure first, and then use indicators as support.
3. Treat support and resistance as zones
Prices do not always reverse at an exact number. Use a reasonable area and look for confirmation within or around it.
4. Wait for candle closure
An unfinished candle can change significantly before the period ends. Base decisions on completed candles when the strategy requires confirmation.
5. Compare volume with recent activity
One volume bar has limited meaning without context. Compare it with normal activity over previous periods.
6. Avoid trading in the middle of a range
The middle often offers unclear direction and weak risk-to-reward conditions. Consider waiting near an important boundary or for a confirmed breakout.
7. Reduce risk during high volatility
Large candles and fast movement do not justify larger positions. They often require smaller exposure and more careful execution.
8. Define invalidation before entry
An invalidation point explains when the original analysis is no longer valid. Set it before entering rather than after the price moves against you.
9. Separate analysis from prediction
Good analysis describes scenarios, levels, and risks. It does not claim certainty about the next price movement.
10. Keep emergency funds outside crypto
No chart setup is reliable enough to justify risking money needed for essential expenses.
11. Check liquidity before trading
A chart may appear attractive, but weak liquidity can lead to poor execution, large spreads, and unpredictable price movement.
12. Use fewer indicators
A simple chart is easier to interpret and review. Add a tool only when it answers a specific question.
13. Record emotional decisions
Write down whether fear, greed, boredom, frustration, or social pressure influenced the action. Recognising emotional patterns is an important part of improving discipline.
14. Review fees and taxes
Trading costs can reduce results, especially during frequent activity. Readers should also understand the applicable tax and reporting rules in their jurisdiction.
15. Accept that some setups should be rejected
A disciplined trader does not need to trade every chart. Avoiding unclear, illiquid, or highly emotional situations is a valid decision.
Case Studies: How Better Understanding Changes Decisions
Case Study 1: The First-Time Bitcoin Buyer
Profile: A 29-year-old salaried professional who has never analysed a financial chart.
Situation: Bitcoin rises rapidly over several days, and colleagues begin discussing further gains.
Problem: The buyer feels pressure to enter immediately and considers using money reserved for upcoming household expenses.
Wrong approach: The buyer plans to purchase based only on recent price gains and social media excitement.
Better approach: The buyer studies the daily and weekly charts, identifies that the price is near a previous high, and observes unusually large candles. The buyer separates essential savings, creates a maximum allocation, and waits for a clearer setup instead of making one emotional purchase.
Result or learning: The buyer understands that chart analysis cannot predict the market, but it can reveal when price movement and emotional pressure are unusually high.
Key takeaway: A chart should support a financial plan, not replace one.
Case Study 2: The False Breakout Trader
Profile: A beginner swing trader using a four-hour chart.
Situation: A cryptocurrency moves above a resistance zone during an active trading session.
Problem: The trader assumes every movement beyond resistance is a confirmed breakout.
Wrong approach: The trader enters before the candle closes and places no clear invalidation point.
Better approach: After reviewing the mistake, the trader develops a breakout checklist requiring a candle close, supportive volume, reasonable entry distance, and a defined exit if the level fails.
Result or learning: The trader still experiences losing trades, but decisions become more consistent and losses are limited according to the written plan.
Key takeaway: Confirmation and risk control matter more than predicting every breakout correctly.
Case Study 3: The Indicator-Heavy Learner
Profile: A university student learning crypto technical analysis.
Situation: The student adds several moving averages, momentum oscillators, volatility bands, and automated signals to one chart.
Problem: Different indicators provide conflicting information, causing hesitation and repeated strategy changes.
Wrong approach: The student keeps adding more tools to remove uncertainty.
Better approach: The student returns to a clean chart, identifies the trend and major zones, and uses only volume and one momentum indicator for additional context.
Result or learning: The chart becomes easier to understand, and the student can explain the reason for each decision.
Key takeaway: More indicators do not automatically create better analysis.
Risk Awareness: What Readers Must Check First
Market risk
Market risk is the possibility that the cryptocurrency price will move against the position.
Reduce this risk by limiting exposure, diversifying responsibly, and avoiding money needed for essential expenses.
Volatility risk
Crypto can experience large and sudden price movements.
Reduce volatility risk by using smaller positions, avoiding excessive leverage, and allowing enough space for normal price movement.
Liquidity risk
Liquidity risk appears when an asset cannot be bought or sold easily at the expected price.
Check spreads, trading activity, market depth, and the reputation of the trading venue.
Platform risk
Exchanges and trading platforms may face operational problems, withdrawal restrictions, cybersecurity incidents, or business failure.
Evaluate custody arrangements, security practices, withdrawal options, and regulatory status where relevant.
Fraud risk
Fake platforms, investment groups, support accounts, and trading schemes may promise unrealistic returns.
Avoid guaranteed-profit claims, verify platform details independently, and never transfer funds because of pressure from an unknown person.
Leverage and liquidation risk
Leverage magnifies price exposure and can cause rapid losses or forced liquidation.
Beginners should understand the complete product, fees, funding rules, and liquidation mechanics before considering leveraged trading.
Misinformation risk
Online content may omit conflicts of interest, paid promotions, risk factors, or the creator’s actual position.
Use multiple reliable sources and perform independent analysis.
Emotional risk
Fear, greed, frustration, and overconfidence can damage an otherwise reasonable plan.
Use predefined rules, take breaks after losses, and avoid decisions made under pressure.
Cybersecurity risk
Phishing links, fake wallet applications, malicious smart contracts, and stolen login details can cause permanent loss.
Use strong security practices, verify addresses, enable suitable account protection, and keep recovery information private.
Tax and legal risk
Crypto transactions may create reporting, taxation, or compliance responsibilities depending on the jurisdiction.
Maintain transaction records and consult a qualified professional when needed.
Data privacy risk
Unnecessary sharing of identity documents, account screenshots, wallet balances, or personal information can expose users to fraud.
Share information only through verified and necessary channels.
Readers should verify all important details and seek qualified financial, tax, legal, or investment advice where their situation requires it.
Checklist Before Taking Action
- I have confirmed the cryptocurrency pair.
- I know whether the instrument is spot, futures, perpetual, or another product.
- I selected a timeframe that matches my decision.
- I checked the broader market trend.
- I marked only the clearest support and resistance zones.
- I reviewed trading volume.
- I am not relying on one candle or indicator.
- I identified bullish, bearish, and neutral scenarios.
- I defined what would invalidate my analysis.
- I calculated the maximum acceptable loss.
- I reviewed liquidity, spreads, fees, and slippage.
- I understand any leverage or liquidation risk.
- I have kept emergency and essential funds separate.
- I have avoided guaranteed-return claims.
- I verified the platform and protected my account information.
- I considered tax, legal, and record-keeping responsibilities.
- I am not acting because of fear, greed, or social pressure.
- I am prepared to avoid the trade if conditions are unclear.
- I have considered professional advice where appropriate.
- My decision is written and understandable.
Use this checklist before each significant crypto decision. A “no” answer does not always mean the opportunity is invalid, but it indicates that more review may be needed. The purpose is to slow down impulsive action and create a consistent decision process.
Strategic Insights for Better Decision-Making
Use multi-timeframe alignment
Multi-timeframe analysis compares the broader trend with the intended entry timeframe.
For example, a trader may use the daily chart to identify an uptrend, the four-hour chart to find a pullback, and the one-hour chart to study confirmation.
The mistake is using too many timeframes without defining the role of each one. Select a context timeframe and an execution timeframe.
Focus on position sizing
Position sizing often matters more than finding a perfect entry.
Suppose two traders enter the same setup. One risks a small, planned amount, while the other uses most available capital. The chart is identical, but the financial and emotional risks are very different.
Start with the acceptable loss and calculate the position from there.
Build risk-to-reward awareness
Risk-to-reward compares the possible loss with the reasonable potential gain.
A high potential reward does not make a trade good if the target is unrealistic. Use visible market structure rather than inventing distant targets only to make the ratio attractive.
Understand invalidation
An invalidation level should be linked to the analysis.
For example, if the idea depends on support holding, a confirmed break below that area may invalidate the setup. Moving the level repeatedly can turn a planned trade into an uncontrolled loss.
Avoid herd mentality
Herd mentality occurs when people act mainly because others appear to be buying or selling.
Large online communities can create urgency, but popularity is not chart confirmation. Review the price location, volume, liquidity, and risk independently.
Separate investment and trading accounts
An investor may hold an asset based on long-term research, while a trader may enter and exit the same asset using short-term chart conditions.
Mixing the two plans can create confusion. A failed short-term trade should not automatically become a long-term investment.
Review chart performance by process
Do not judge analysis only by whether the price later rose or fell.
Review whether the pair, timeframe, trend, zones, volume, risk, and execution were examined correctly. A good process can produce a loss, and a poor process can sometimes produce a profit.
Use scenario planning
Create at least three scenarios:
- Bullish continuation
- Bearish breakdown
- Sideways consolidation
Write the evidence and appropriate response for each scenario. This reduces the temptation to defend one fixed prediction.
Recognise market regime changes
A strategy that performs well in a trend may struggle in a range. A breakout strategy may generate repeated false signals during low-volume consolidation.
Identify whether the market is trending, ranging, highly volatile, or unusually quiet before choosing a method.
Protect wallet custody
Chart reading helps with market decisions, but it does not protect crypto assets from security failures.
Understand whether assets are held on an exchange, in a software wallet, or through another custody method. Keep private keys and seed phrases secure and offline where appropriate.
Confirm transaction details
Blockchain transactions may be difficult or impossible to reverse.
Before transferring crypto, verify the network, asset, destination address, memo or tag requirement, and transaction fee. Consider a small test transaction when appropriate.
Understand network fees
Network fees can vary depending on blockchain demand and transaction complexity.
A profitable-looking trade or transfer may become inefficient after network and platform costs are included.
Key Terms Explained for Beginners
- Trading Pair: A trading pair shows the value of one cryptocurrency relative to another asset. BTC/USDT compares Bitcoin with USDT.
- Candlestick: A candlestick displays the opening, highest, lowest, and closing prices for a selected period.
- Timeframe: A timeframe determines how much market activity each candle represents, such as one hour, four hours, or one day.
- Open Price: The open is the first traded price recorded during the candle’s period.
- Close Price: The close is the final traded price recorded before the candle’s period ends.
- Wick: A wick shows how far the price moved above or below the candle body.
- Volume: Volume represents the amount of trading activity during a period. It helps readers evaluate participation behind price movement.
- Trend: A trend is the broader direction of price. It may be upward, downward, or sideways.
- Support: Support is a price area where buying interest has previously become strong enough to slow or reverse a decline.
- Resistance: Resistance is a price area where selling pressure has previously slowed or reversed a rise.
- Breakout: A breakout occurs when the price moves outside an established zone or pattern. It still requires confirmation because some breakouts fail.
- Pullback: A pullback is a temporary move against the broader trend.
- Volatility: Volatility describes the speed and size of price changes. Higher volatility can increase both opportunity and risk.
- Liquidity: Liquidity describes how easily an asset can be bought or sold without causing a large price change.
- Indicator: An indicator is a calculation based on price, volume, or related data. It supports analysis but cannot guarantee an outcome.
Who Should Read This Blog
Beginners
Beginners can use this guide to understand candles, trends, volume, and price zones before taking financial risks.
Students
Students studying finance, blockchain, or trading can build a practical foundation without beginning with overly complex indicators.
Salaried employees
Salaried professionals can learn why emergency funds and essential savings should remain separate from speculative crypto decisions.
Small business owners
Business owners can understand market risk before allocating surplus cash to volatile digital assets.
New investors
New investors can use higher-timeframe charts to avoid chasing short-term excitement and to improve entry discipline.
Traders
Traders can strengthen their process for timeframe selection, confirmation, invalidation, and position sizing.
Loan seekers
Anyone carrying debt or considering a loan should understand that borrowing money to speculate in crypto can create serious repayment pressure.
Crypto learners
Crypto learners can develop a structured method instead of depending on signals, influencers, or guaranteed-return claims.
Casino content creators
Writers covering crypto casino topics can use this knowledge to discuss cryptocurrency volatility and responsible financial behaviour more accurately.
Finance bloggers
Finance writers can explain chart concepts with balanced, risk-aware, and educational language.
People improving money awareness
The guide supports readers who want to understand investment risk, emotional decision-making, and capital protection.
People trying to avoid financial mistakes
Readers who previously chased prices, overtraded, or followed random tips can use the frameworks to create a more disciplined process.
Frequently Asked Questions
1. What does it mean to read a crypto market chart?
Reading a crypto chart means examining price candles, timeframes, trends, volume, support, resistance, and indicators. The goal is to understand market behaviour and possible scenarios, not to predict every move with certainty.
2. How can beginners learn how to read crypto market charts?
Beginners should start with the trading pair, timeframe, OHLC candles, trend, support, resistance, and volume. Indicators should be added only after basic price structure is understood.
3. Which crypto chart type is best for beginners?
Candlestick charts are useful because they show the open, high, low, and close for each selected period. Line charts may be easier for seeing the broad trend, but they provide less detail.
4. What timeframe should a beginner use?
The suitable timeframe depends on the purpose. Long-term investors may focus on weekly and daily charts, while swing traders may use daily and four-hour charts. Very low timeframes can contain more noise and require faster decisions.
5. Can crypto charts predict future prices accurately?
No chart method can predict every future price movement. Charts help evaluate trend, momentum, participation, and risk, but unexpected news, sentiment, liquidity, and market behaviour can invalidate any setup.
6. What are support and resistance in crypto charts?
Support is an area where buying interest has previously slowed a decline. Resistance is an area where selling pressure has previously slowed a rise. Both should usually be treated as zones rather than exact prices.
7. Why is trading volume important?
Volume helps show how much activity supports a price move. Rising volume can strengthen the significance of a breakout or reversal, but high volume can also occur during panic selling or liquidation.
8. Which indicators are useful for beginners?
A moving average can help identify trend, while RSI can help examine momentum. Beginners should use only a small number of indicators and combine them with price structure and risk management.
9. What is the biggest mistake in crypto chart analysis?
One of the biggest mistakes is treating a single candle, indicator, or online prediction as complete evidence. Stronger analysis uses several independent factors and defines what would make the idea invalid.
10. Is learning how to read crypto market charts useful for investors?
Yes. Long-term investors can use charts to understand broad trends, volatility, and major price zones. However, charts should be combined with project research, portfolio planning, and risk tolerance.
11. Should beginners use leverage after learning chart analysis?
Learning chart analysis does not make leverage safe. Leverage increases exposure, losses, fees, and liquidation risk. Beginners should fully understand the product and consider whether avoiding leverage is more appropriate.
12. What is the best next step after learning how to read crypto market charts?
Practise on historical charts without risking money. Mark the trend, support, resistance, volume, scenarios, and invalidation point. Keep a journal and review whether the process was consistent.
Conclusion
Learning how to read crypto market charts helps beginners understand price trends, candlesticks, volume, support, resistance, and market risk more trends, candlesticks, volume, support, resistance, and market risk more clearly. Charts cannot guarantee future results clearly. Charts cannot guarantee future results, but they can support better planning and reduce emotional decisions. Beginners should practise, but they can support better planning and reduce emotional decisions. Beginners should practise with simple charts, use only a few indicators with simple charts, use only a few indicators, verify every signal, and always define their risk before investing, verify every signal, and always define their risk before investing or trading. A disciplined approach, proper or trading. A disciplined approach, proper research, and strong security research, and strong security habits are more valuable than following random predictions or profit claims.